Humminbird MEGA Imaging Insights
With the recent introduction of Humminbird MEGA Imaging, we set out to examine the differences between this new 1.2 MHz imaging frequency and the more traditional 455 kHz imaging frequency. Simple physics principles dictate that MEGA Imaging, at 1.2 MHz, should have a shorter effective range than 455 kHz. Moreover, MEGA Imaging, due to its substantially higher frequency, should be able to provide images with greater resolution than 455 kHz. But how do these differences manifest themselves once we leave the physics lab and install a MEGA Imaging system on our boat? Let's find out!
Part 1: Structure
Let us first consider structure, a common target of those equipped with a Side Imaging fishing system. We set out to examine a collection of man-made structural elements that we have examined many times over the years, a collection that has become one of the places where we take our on-the-water trainees so they can learn to optimize their Side Imaging settings. This array of structure includes several man-made fish cribs, sitting just off shore in ~16 feet of water, and also includes a sunken boat: a 14-foot Alumacraft with an enclosed bow, that has settled to the bottom upright. Here's how this area appeared 8 years ago, when we first imaged it with a Humminbird 997c SI using 455 kHz as the imaging frequency.
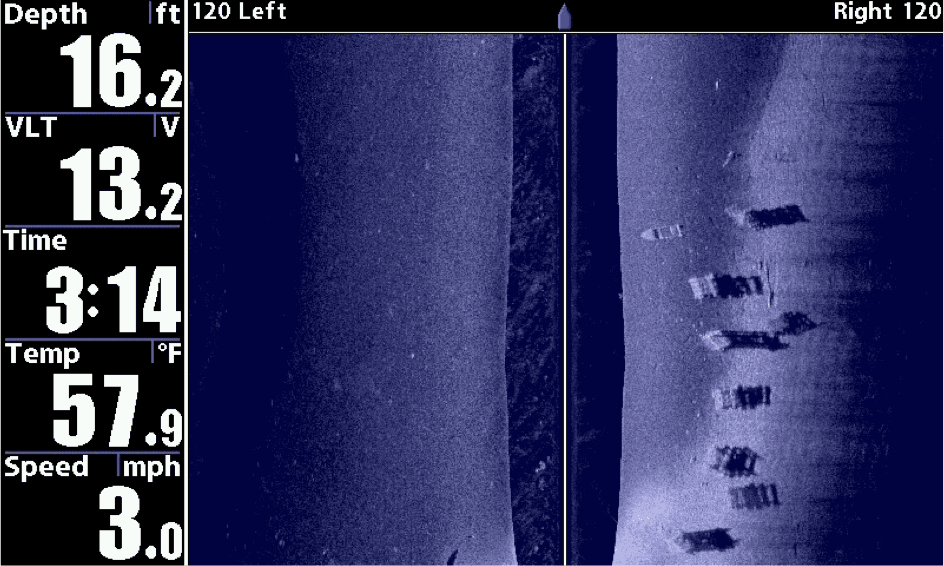
There are several things to note about this image. First, notice that we can see the back seating bench in the Alumacraft. Second, note that the left Side Image doesn't have any cribs in it. And third, perhaps most importantly for the discussion, take a close look at the individual logs in the fish cribs. While the logs are easy to see and can be distinguished from each other, notice that the edges of the logs are hazy, or fuzzy. Now, let's fast-forward to the present day, and take another look at this same area with 455 kHz, but this time with a Humminbird SOLIX 12 SI:
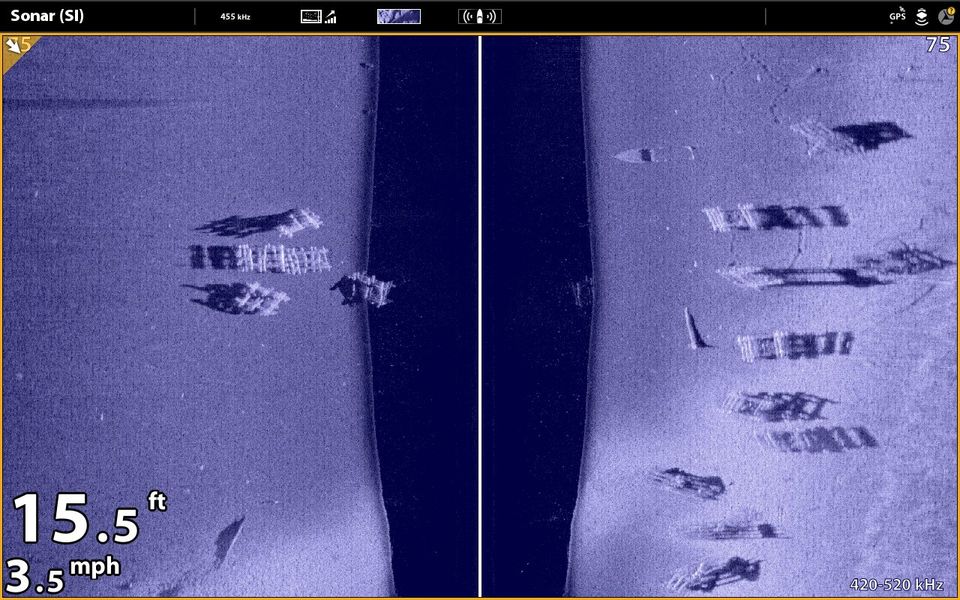
Some obvious differences, right? First, notice that we can no longer see the back bench in the Alumacraft. 8 years of sedimentation has buried it as the boat sinks deeper into the muck. Second, notice that the lake association has added a cluster of offshore cribs to this area, clearly visible in the left Side Image. Third, notice that the edges of the logs in the fish cribs are a little sharper. This is because we are CHIRPing around the 455 kHz frequency, transmitting (and receiving) a range of frequencies from 420-520 kHz. CHIRP does a nice job of making a good image (in terms of detail, sharpness, and contrast) a little better. Now, let's switch over to MEGA Imaging and examine this same area:
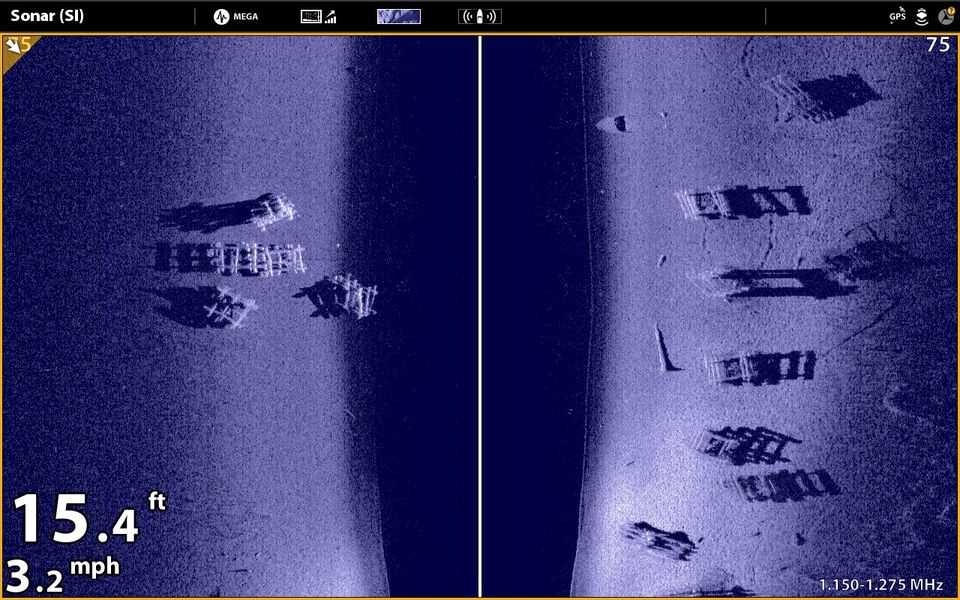
This last image, obtained by CHIRPing around the MEGA Imaging frequency, exhibits some enhancements over the traditional 455 kHz image. Those enhancements are primarily associated with the resolution of the pieces of structure (how sharp their edges are) and their sonar shadows. In both cases, the edges are cleaner, with less fuzziness for the structure and the shadows. This increase in resolution (image sharpness and clarity) is entirely consistent with the higher imaging frequency range. Notice also that image intensity is tapering off towards the edges of the Side Imaging range, especially compared to the 455 kHz image above, an image that has relatively uniform intensity throughout the Side Imaging range. This decrease in image intensity at longer ranges is also consistent with the properties of this high frequency MEGA Imaging beam. In our experience, using MEGA Imaging with both HELIX and SOLIX, the optimum Side Imaging range for MEGA Imaging is between 75 and 90 feet.
So why is a higher resolution image, with sharper, crisper edges for both structure and sonar shadows, an important tool for the angler? For a situation like the one examined above, the benefits would primarily come in being able to more easily identify fish that are holding tight to the structure. Those fish might be missed with traditional 455 kHz imaging, as the fuzzy edges of the structure might be able to conceal a fish tucked in tight. With MEGA Imaging, however, the edges of the structure will be noticeably sharper, making nearby fish easier to identify and pursue.
If you're ready to learn more about the ways we interpret Side Imaging (as well as Down Imaging and traditional 2D Sonar), be sure to check out our latest instructional DVD, Angler's Guide to Sonar Interpretation. Be sure to join us again for Part 2 of this MEGA Imaging series, where we examine MEGA Imaging applications for finding fish.